
November 02, 2022
Source: Bigstock
With elections a few days away, crime statistics are finally being widely discussed in the press. So…I’m not going to pass up one last chance to deluge you with new graphs based on the CDC’s WONDER database of causes of death.
Democratic politicians have been flailing about looking for a way to get off the hook for the historic increase in murder and car crash mayhem ever since our respectable class’ leaders declared “the racial reckoning” was at hand following the unfortunate expiration of George Floyd on May 25, 2020.
For example, New York’s Democratic governor, Kathy Hochul, suddenly finding herself in a tight race with Lee Zeldin largely over the crime surge, kvetched to Zeldin in a debate about crime, “I don’t know why that’s so important to you.”
She then declared on Rev. Al Sharpton’s show this week that Republican complaints about rising crime are a conspiracy theory:
These are master manipulators. They have this conspiracy going all across America trying to convince people in Democratic states that they’re not as safe. Well, guess what: They’re also not only election deniers, they’re data deniers.
Before getting to the red state vs. blue state issue that everybody wants to talk about, let’s look at the national murder trend, which has been jaw-dropping.
The Centers for Disease Control maintains a useful WONDER database of causes of death that anybody can use to look up, say, homicide victimizations or motor vehicle fatalities by race or any other trait they care to know about. The time period covered by the CDC is January 1999 until six months ago, which at the moment extends through March 2022.
I’ve graphed homicide victimizations by month:
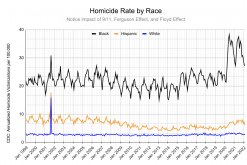
As you can see, the black homicide victimization rate reached levels previously unknown in this century during the racial reckoning and has stayed highly elevated ever since.
The Floyd Effect has been immense by historical standards. In contrast, you can clearly see the Ferguson Effect caused by the first time in 2015–16 that the Great and the Good hyped the misnomered Black Lives Matter movement. But the Ferguson Effect is subtle compared with our ongoing Floyd Effect.
You’ll also note how seasonal black homicide is (and, of course, the vast majority of these black deaths were at the hands of another black). This time, I adjusted for the number of days in each month. But even so, February remains the usual low point in the black murder year, with July being the typical peak. Blacks were killed about 22 percent more in June to August than in December to February. For Hispanics, the seasonal gap was 18 percent, and for whites only 7 percent. Apparently, winter depresses people who evolved without much winter, which can be a good thing.
Something that stands out with the Hispanic trend line is how much the Latino homicide rate improved after the popping of the Housing Bubble in 2008. Perhaps there was a big outflow back to Mexico of the least employable Mexicans? Are we returning your worst?
While the Hispanic homicide rate didn’t grow as fast as the black rate in 2020, Latino criminals appear to have gotten adjusted to the New Normal in 2021, unfortunately, and are back to Housing Bubble levels of killing and being killed.
Why have blacks been shooting each other in such remarkable numbers over the past couple of years? The conventional wisdom is that this must be due to Covid, although nobody seems to be able to explain why.
Perhaps the most plausible Covid-related theory is the least popular: that all the economic stimulus stimulated more Deaths of Exuberance, such as murders and car crashes.
The argument I find most persuasive for why black-on-black shootings erupted during the anti-cop mania of 2020 is that when our society’s leadership told police to not pull over blacks so often, they obeyed. With reduced fear of being stopped and searched, blacks then started carrying illegal handguns more and driving worse. Thus, the black car crash death rate also exploded in June 2020:

Blacks don’t drive as many miles as whites do, but per capita, blacks tended to die less than whites on the roads until the Ferguson Effect got rolling. Since then, bad driving seems to have become a black thing, whereas traditionally blacks tended to have a stereotype of being reasonably cool behind the wheel. (Picture 1970s pimps driving 12 miles per hour around their turf.)
Then, in June 2020, black traffic fatalities were suddenly 55 percent higher than in June 2019, one of the more shocking changes known to the social sciences.
Also, Latinos got quite a bit worse at driving in de-policed 2021 than they’d been in the calm years after the Bush Bubble.
Now, what about the red vs. blue question that everybody would prefer to discuss rather than the unpleasant subject of enduring racial gaps?
Democratic talking points are based on a March Third Way document: “The Red State Murder Problem.”
8 of the 10 states with the highest murder rates in 2020 voted for the Republican presidential nominee in every election this century.
When I ask the CDC website for homicides by state, it turns out the worst rate is in the ultra-liberal District of Columbia, where Trump won only 5 percent of the vote in 2020. Granted, D.C. isn’t exactly a state, but it has three electoral votes in presidential elections, so it seems highly relevant to Third Way’s question.
And, when I graph each state’s homicide victims by race for 2018–2021, the unmentionable truth becomes clear. States with high homicide rates usually are that way because loyal Democratic blacks are shooting each other a lot:
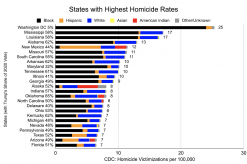
Indeed, one reason states with lots of black murderers like Mississippi and Alabama are so reliably Republican is because whites feel they need to stick together to avoid letting law and order be lost to steadfast Democrat blacks. From 2018 to 2019, blacks were 9.8 times more likely than whites to die by homicide, which is a lot.
As nation-builder Lee Kuan Yew skeptically observed about our sacred value of Diversity: “In multiracial societies, you don’t vote in accordance with your economic interests and social interests, you vote in accordance with race and religion.”
In contrast, in nearly all white (and heavily armed) Vermont, it’s safer to vote for liberals because voters aren’t at much risk from crime. On the other hand, highly conservative Idaho, to the surprise of Wire showrunner David Simon, is about as safe as Vermont. It’s nice to have the luxury that Vermont and Idaho voters enjoy to express their inner feelings at the ballot box, but Mississippians do not experience that freedom.
There are some exceptions to this rule that homicidal states are quite black. New Mexico is fifth-worst due to many Hispanic and American Indian homicides. (New Mexico doesn’t attract many Latin American immigrants, so many of its Hispanics can trace their roots in New Mexico to the 17th century.) Alaska is home to frequent native and Pacific Islander carnage. Oklahoma (state song, “All My Exes Live in Texas”) has ornery residents of every color.
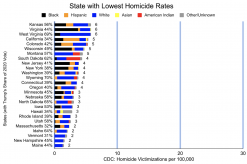
Safe states tend to have few blacks (or American Indians).
I included Trump’s share of the vote in 2020 on the graphs to give some sense of the ideological leanings of local voters. Of course, it’s all much more complicated than that. Most Americans are under the jurisdiction of four separate levels of government: federal, state, county, and municipality, each with a finger in the pie of the criminal justice system. It’s easy to claim a region is red or blue depending upon the partisan point you are trying to make.
The New York City region (including New Jersey) has had impressively low murder rates in recent decades, with mayors Rudy Giuliani and Michael Bloomberg along with police chief William Bratton all vying to take credit for New York’s stunning fall in crime. Of course, the NYPD was encouraged to use tactics that flyover police departments like Ferguson’s were forbidden, but, then, important people live in NYC, so their safety is important.
But some credit should be reserved for the hypocrisy of New York City’s nominally Democratic voters, who, while still voting Democrat at the presidential level, defeated the Democratic nominee for local mayor in five straight elections from 1993 to 2009. They were rewarded with New York becoming vastly less crime-ridden than under previous regimes.
And of course, the really large concentrations of homicides are in the big cities. The CDC doesn’t report deaths by municipality, just by county. So I’ve graphed the 25 counties with the most homicides over the previous four years (not with the biggest population). That way I include both the really big counties like Los Angeles (low homicide rate by urban standards) and Cook (medium rate) counties and the really homicidal ones like Shelby (Memphis) and Philadelphia counties and Orleans parish, along with the separate cities of St. Louis, Baltimore, and D.C.:
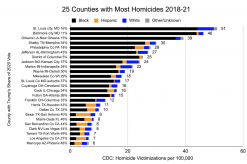
The only nonurban county in the top 25 for homicides is St. Louis County, which is the suburbs of St. Louis City, such as…Ferguson.
Once again, the dangerous places are highly black. In the safer urban counties, a sizable fraction of the homicide victims (and likely the murder perpetrators as well) are Hispanic.
Since 1990, a huge gap has opened up between blacks and Hispanics in their murder rates, despite their comparable socioeconomic status. This should serve to befuddle purveyors of the conventional wisdom, but they don’t care.
There don’t appear to be any big cities with high white homicide rates, other than perhaps in Missouri and Indiana, although that could be due to blacks victimizing whites.
My point is not that any single policy set off the vast wave of shootings two years ago, but that the zeitgeist went insane in the last week of May 2020, with horrific consequences. As my June 3, 2020, column was headlined, it was “The Bonfire of the Insanities” as the Establishment egged on looters, arsonists, and murderers in the name of anti-racism.
It’s time for some consequences.
Granted, electing a different set of politicians is unlikely to make things all that much better, but at least it sends a message.