May 27, 2009
While economists and real estate investors “celebrate” the slight deceleration in the pace of home price declines in the recent data, a quick look at home price trajectories over the past 100 and 50 years reveals little to cheer about and much to be feared.
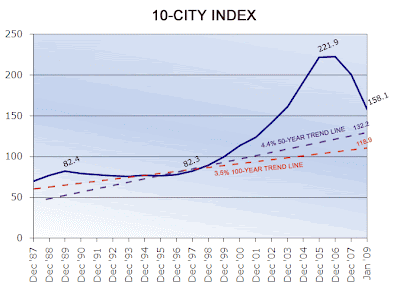
More significant than small month-to-month changes is the flow of home price patterns over decades. In his book Irrational Exuberance, Robert Shiller determined that in the 100 years between 1900 and 2000, home prices in the U.S. increased by an average of about 3.4% per year. These figures have not been adjusted for inflation. If they had, home prices would have outpaced inflation by only the slimmest of margins.
This 100-year period includes the Great Depression, when home prices sank significantly, and it also involves decades in which our current home mortgage infrastructure simply did not exist. The second half of the century, with its baby boom, heightened inflation, suburban expansion and institutionalized mortgage apparatus, was much kinder to home prices. Even so, in the 50 boom years between 1950 and 2000, home prices increased an average of 4.4% per year. Even this pace barely beat inflation.
See The Historical Case-Schiller Home Price Index here
By all accounts, the home price boom that began in late 1997 (when the high of the previous 1989 peak was finally eclipsed) and topped out in June 2006 was extraordinary. The Case-Shiller 10-City Index, an amalgam of the home price trends in 10 of the largest U.S. cities, gained on average 19.4% per year during that time. The movements had very little to do with market fundamentals and everything to do with distortive government policies, a national mania for real estate wealth and a torrent of temporarily easy credit.
If we assume that the bubble was artificial, we can instead imagine that home prices should have followed the more typical path during that time. When you do these extrapolations, a very sobering picture emerges.
The authors of the Case-Shiller index had assigned the index a value of 100.0 in January of 2000. This figure does not represent a dollar value for home prices but is simply a benchmarking tool. In December 2008, after a severe 28% decline from its June 2006 peak of 226.29, the Case-Shiller 10 City index stood at 162.1. However, if home prices had followed the 3.4% annual 100-year trend line from December 1997 (when the index was at 82.3), then the index would have arrived at only 118.92 in December 2008.
This would suggest that the index would need to decline an additional 27% to get back to the historical trend line. Extrapolating along the sunnier 50-year annual average increase would put the index at 132.2 by December 2008. This would still put the trend line 18.5% below current prices.
A cursory look at the chart below should disabuse anyone of the notion that home prices have now hit bottom. Policymakers and economists should by no means rely upon projections that see home prices turning around in the near term.
 |
| From TARP!!! |
However, the story by no means ends there. Given the current conditions in the real estate market, with bloated inventories, growing unemployment, nonexistent consumer credit and shattered illusions of real estate riches, it would be logical to assume that prices will fall below the trend line. How much is anybody’s guess, but 10% would be conservative.
Given that we are entering uncharted territory with price declines much sharper than those seen in the Great Depression, I would argue that the 100-year price trend would be the better projection to use. In such a scenario, the index would bottom out at around 108 if a 10% overshoot on the downside is seen. That leaves another 34% decline in home prices on the table.
But that doesn’t mean that I believe home prices will actually reach those levels, at least in nominal terms. Inflation will likely be the biggest difference between the current recession and what is now called the Great Depression of the 1930s, (I expect a new name will be needed in a few years, much as the Great War is now called World War I.) Throughout the Depression, prices fell for everything, not just houses. At the time, even the pump-priming policies of Roosevelt’s New Deal did not expand the money supply at anywhere near the current pace. As a result, the deflationary pressures of a recession were allowed to push prices down.
In the coming years, the opposite will happen. The government, through deficit spending, stimuli and bailouts, is literally pumping trillions and trillions of new dollars into the economy. Once the bloated inventories of the boom years are worked through, this torrent of new cash will push prices up with across the board. Inflation, more virulent than the variety seen in the 1970s, will put a nominal floor under home prices. But the benefits of seemingly stable home prices will be illusory. What good is a $200,000 house if it costs nearly that much to fill the refrigerator?
However, inflation putting a floor under home prices does nothing to increase real demand for houses. With the prices for stocks, commodities and food going up faster than the prices of homes, residential real estate will remain a lousy investment. As a result, be wary of those who have called a housing bottom and now recommend beaten-down homebuilding stocks.
Despite savage pullbacks from their mid-decade highs the nation’s biggest homebuilders are still overvalued. The S&P 500 is down 4% since the last housing boom began in January 1998. But over that time, Toll Brothers(TOL Quote), Pulte Home(PHM Quote) and D.R. Horton(DRI Quote) are up 195%, 100%, and 97% respectively. The truth is, America’s current inventory of homes will last at least a generation or more. These stocks are still not priced accordingly.