September 28, 2022

Singapore
Source: Bigstock
At least since the 2002 book IQ and the Wealth of Nations by Richard Lynn and Tatu Vanhanen, social scientists have been publishing rankings of countries by average cognitive test scores and pointing out how closely these figures correlate with gross domestic product per capita.
The mere existence of this data causes outrage among the growing numbers of science denialists, who are increasingly calling for banning all scientific research touching upon differences in cognitive capabilities among populations.
On the other hand, investors want to know these numbers because they are closely linked to national prosperity. So, I’ll present below my three-part graph of the World Bank’s “Harmonized Learning Outcomes” for 174 countries.
Two main types of cognitive exams contribute to the various lists: IQ and school achievement.
Intelligence testing has been one of psychology’s biggest success stories for the past 117 years but is much denounced by the ignorant. In contrast, school achievement exams, such as the OECD’s PISA test, are (or were) highly respectable. They even were briefly fashionable during the school reform craze of a decade ago.
National average IQ estimates typically come from intelligence test publishers who need to validate a new edition of their test in each country in which it will be sold. This requires testing it on a sample of usually a few hundred people to make sure nothing weird is going on with the new questions.
International school learning tests have been massive projects since the first TIMSS/PIRLS tests in 1995 and PISA test in 1997. They generally aim for sample sizes in the thousands in each country.
Theoretically, these two approaches could produce wildly different results: e.g., we might speculate that the Scottish Highlands and inland Finland in, say, 1500 were full of clever, high-IQ but poorly educated barbarians and backwoodsmen. But we just don’t know. (We might eventually be able to grave-rob enough skeletons from old churchyards, recover their DNA, and measure their innate educability from their genomes. But even that wouldn’t tell us about their cognitive performance in 1500.)
What we do know is that in this century, both methodologies—IQ tests and school tests—tend to generate similar results. National average IQ and school test scores are closely correlated.
This could be because IQ drives school performance—an unpopular but reasonable view.
Alternatively, strong schools could make children smarter. For example, in the U.S., federal NAEP scores dropped sharply when schools switched to remote learning during the pandemic.
Both causal pathways sound plausible to me.
Or, either factor, or both, could interact with their third close correlate of national wealth. But what causes what?
For example, over the last two-thirds of a century, South Koreans have increased spectacularly in GDP per capita, average test scores, and height. Good things seem to go together, but which causes which is less obvious.
On the other hand, countries rising or falling dramatically in the rankings take decades to manifest and don’t happen all that often. Thus, interest in the triennial PISA faded over the last decade because nothing much changed in its results. PISA results would be exciting if new prime ministers could suddenly drive up test scores, but they can’t. In the real world, it’s hard to wring clickbait headlines out of Estonia finally overtaking Finland for the top spot among white countries.
One issue has been that most of the recurrent participants in the two big international school tests, PISA and TIMSS, have been more or less first-world countries. European countries tend to score within a fairly narrow band not too much wider than the margin for error. (Inevitably, there’s a lot of noise in the data: Just think about how much work is involved in giving tests in different languages.)
So, yeah, sure, test scores show that Finns on average are probably a little smarter than Serbs (but technology hero Nikola Tesla was pure Serb, so don’t get carried away by averages). Yet for most of Western Europe, whether one country outscores another tends to depend more upon the quantity and quality of its immigrants than upon slight differences between the natives.
Still, global patterns in test scores are visible: Typically, countries primarily populated by northeast Asians, such as the vastly prosperous city-state of Singapore, rank near the top, followed by European-dominated countries. (Interestingly, the obscure northeast European countries of Finland and Estonia do better on school test scores than the more famous northwest European ones.) Latin American, Middle Eastern, and South Asian countries tend to follow (with Muslim countries generally doing somewhat worse than their non-Muslim neighbors), with sub-Saharan states at the rear.
But poor countries seldom gear up for the big PISA or TIMSS tests because they are both expensive and discouraging: Thanks for proving our schoolkids aren’t as smart as the Japanese or Poles. And tell us something we didn’t already know.
Fortunately, regional tests have emerged to allow African (SACMEQ for 16 states in southern and eastern Africa and PASEC for 10 west African nations) and Latin American (LLECE) countries to compete against their neighbors on an equal footing.
And there is now the Early Grade Reading Assessment (EGRA) of basic literacy that has been administered in 65 countries.
As explained in their 2021 paper in the top science journal, Nature, “Measuring human capital using global learning data,” researchers affiliated with the World Bank have now compiled a database of what they call “harmonized learning outcomes” (HLOs: i.e., test scores) with over 2,000 data points.
By “harmonized” they mean they’ve linked scores on the famous global exams to the smaller regional ones. For example, Colombia, El Salvador, Chile, and Honduras have all taken both the worldwide TIMSS and the local LLECE in the same year, allowing the World Bank boffins to estimate how other Latin countries would have done on the TIMSS from their LLECE scores. They can then link TIMSS to PISA scores and, ultimately, put 174 countries on a single scale with 500 as the Western midpoint and 100 as the standard deviation.
It’s the same ambitious methodology applied internationally as Sean Reardon did with Stanford’s American school test database in which he takes test scores from every school district in the U.S. from the 50 different states and then uses the federal NAEP scores for each state to put all the different state tests on the same gauge.
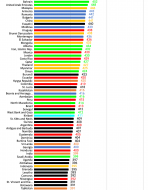
Okay, who won? According to the World Bank, who averaged the highest scores on the various tests from 2000 through 2017?
As you’d expect, the crazy rich Singaporeans averaged 575, followed by Macau and Hong Kong. Estonia did the best among Europeans at 543, slightly ahead of Japan at 538, South Korea 537, Canada and Finland 534, Poland 530, and Ireland 521. The U.S. scored a respectable 512. (As I’ve pointed out before, our kids do pretty well relative to their demographics.)
How good is Singapore’s 575? Well, that’s 0.63 standard deviations higher than the U.S. So the median Singaporean student would score at about the 74th percentile in the U.S., which is a noticeable difference but not immense, rather like the difference between whites and Hispanics in America. On the other hand, the gaps in the normal probability distribution become bigger at the right edge of the bell curve, so Singapore has a much higher percentage of whiz kids than does the U.S.
![]()
Among black countries, Kenya’s 455, in between Serbia and Chile (and above Mexico’s 430), is impressively high for a sub-Saharan state. (Tiny, oil-rich Gabon scored slightly higher on a single data point, while Trinidad is a mixed -ace West Indian island with a substantial Asian Indian population. Likewise, Mauritius and Seychelles are mixed-race Indian Ocean nations.) Kenya took both the math and reading portions of the SAQMEQ in 2000, 2007, and 2013, and averaged between 392 and a Northern European-level 517 on the 2013 math test.
Do I believe these results? Kenya’s report looks reasonably legit, with a claimed sample size of over 5,000 distributed around the country. On the other hand, perhaps schools skimmed their best students? Even in generally honest America, Texas is notorious in testing moneyball circles for scoring high on the NAEP by encouraging its worst students to stay home on the day of the federal test.
Still, Kenya is, by African standards, a pretty nice place. I did a lot of work on African economic statistics in 1981: Kenya had a lower official per capita GDP than West African countries like Nigeria and Ivory Coast, but everything subjective that I read made Kenya sound better than West Africa. For instance, Isak Dinesen famously opened Out of Africa with the nostalgic line, “I had a farm in Africa, at the foot of the Ngong hills,” because she recalled it fondly.
One of the largest Flynn Effects ever recorded was in the Embu district of Kenya where 7-year-olds’ IQs went up 11 points on the Raven’s test between 1984 and 1998 during a time of peace, prosperity, and rural electrification.
In the mid-ranks, Argentina averaged a poor 408, a standard deviation below the U.S. That would put the typical Argentine student at the 16th percentile in America. But in Argentina’s defense, they tend to round up more of their lousy students to take the international tests than do, say, the Mexicans (430).
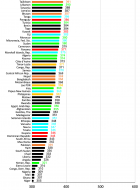
Who came in last? As I’ve mentioned, we shouldn’t get too worked up over small differences in scores. But, just as it’s not surprising that first place goes to Lee Kuan Yew’s right-wing utopian Singapore, it seems like an omen that last place goes to the country with the world’s highest birth rate, Niger.
Please note that down at the bottom of the chart, the number of data points is often rather thin. For example, oil-endowed Nigeria’s disgraceful 309 stems from only a single EGRA test of second to fourth graders. So who knows where giant Nigeria would really fall? The Nigerians don’t.
Among the giga-countries, India’s 399 is based on India trying out the PISA in one northern and one southern state in 2009, bombing it, getting depressed, and never taking an international test again.
China, in contrast, has aced the PISA, blowing away even Singapore. But China only administers the test in the brightest parts of the country. The World Bank team therefore knocks China all the way down to 441, which seems too low to me, but what do I know?
The authors in Nature draw an important distinction between “schooling” and “learning.” For example, they commend Ghana, which is often considered to have the best government in West Africa, for extending primary and even secondary education to almost all children. Yet, so far, little learning seems to be going on in the classrooms of Ghana, which ranks second-to-last in test performance.
A little learning is notoriously a dangerous thing; but, increasingly in our era of science denialism, ignorance is less bliss than mandate.