February 21, 2024

Raleigh, North Carolina
Source: Bigstock
Last week’s Super Bowl parade shooting in Kansas City in which one was killed and 22 wounded was another validation of both Coulter’s and Sailer’s Laws of Mass Shootings.
Ann devised her insight back in 2015 after two Muslim terrorists of Pakistani origin murdered fourteen at a government office in San Bernardino:
The longer we go without being told the race of the shooters, the less likely it is to be white men.
Similarly, the race of the two youths arrested for the Kansas City shooting are still being covered up on the excuse that they are under 18. Fromthe New York Post:
Kansas City Mayor Quinton Lucas accused Missouri Gov. Mike Parson of using a racial “dog whistle” when referring to the suspected shooters at the Kansas City Chiefs Super Bowl parade as “thugs.”…
“The shooting in Kansas City got me thinking about whether Missouri cities are really as shooty as they seem.”“I’ve seen this dog whistle time and again. There’s this kind of giant conservative theory on social media now that the reason these mug shots haven’t been shown is because the purported defendants are black, and if it were a white defendant we would have just shown them. That is absolutely preposterous. There are protections to juveniles,” he added.
Of course, the arrestees are black, according to a photo in the Daily Mail. The Super Bowl parade mass shooting was the usual knuckleheaded dispute that could, at worst, be resolved with fists if African Americans didn’t feel the cultural imperative to start banging away with pistols. But the ruling caste and media work hard to cover up the size of America’s black gun violence problem.
Banning the release of mug shots of juvenile murderers helps hide the horrifying extent of black gun crime because of the immense racial differential in shootings among teens. According to CDC data on the cause of deaths, in 2020–2022 black 17-year-olds were 24 times as likely per capita to die by firearm homicide as white 17-year-olds.
In contrast, I coined Sailer’s Law of Mass Shootings in March 2021:
If there are more wounded than killed, then the shooter is likely black.
If there are more killed than wounded, then the shooter is likely not black.
Sailer’s Law (which is of course a statistical tendency rather than a law of physics) is extremely useful for understanding that there are two very different types of mass shootings.
In the infamous but (fortunately) still fairly rare Columbine-style shootings, the shooter has decided that he’s never coming home, that he’ll die or go to prison for life. So, he sticks around to finish off the wounded. Thus, there wind up more dead than wounded.
In contrast, in the kind of mass shooting that happens five or ten times per week at social events attended by large numbers of blacks, like the Super Bowl parade, numerous wounded survive because the shooter (or, often, shooters) aren’t suicidal. As soon as they hear sirens, they run.
These different types of mass shooting suggest the need for different types of gun control: point of sale vs. point of use. Americans already own several hundred million guns, so the liberal crusade to make it harder to buy new rifles at sporting goods stores has obvious limits to its effectiveness. Only a tiny fraction of mass shootings are carried out with long guns that the shooter bought legally. Instead, blacks typically get their handguns through friends and acquaintances on the black market.
What’s more promising for deterring mass shootings like Kansas City’s is point-of-use gun control: Discourage lowlifes from bringing their illegal handgun with them when out walking or driving. New York City had impressive success at changing the criminal culture toward leaving guns at home. Most of the more-wounded-than-dead mass shootings aren’t the result of some brilliant Michael Corleone-level strategic plan, but are instead due to a moron getting dissed when he happens to have his Glock tucked in his waistband and starts blasting away in the general direction of his rival, plus all the partygoers standing around eating ribs in the background.
On the other hand, my vague impression is that more-dead-than-wounded mass shooters tend to be the type of people who have no friends, so they don’t know a guy who knows a guy who can get them a hot gun. Therefore, they need to buy their guns legally. Thus, point-of-sale gun control aimed at slowing the insane or suicidal when trying to buy guns might have some positive effect.
The shooting in Kansas City got me thinking about whether Missouri cities are really as shooty as they seem.
So, I went to my usual source, the CDC’s WONDER Multiple Cause of Death database, and looked at victimizations by homicide in 2018–2022 for 55 “Large Central Metro” counties, such as Los Angeles, Cook, Maricopa, Harris, and so forth.
In the U.S., death certificates are handled by counties, so the smallest geography listed in CDC downloads are counties. American counties are sometimes coterminous with big cities, but urban counties usually include both a famous central city and its inner-ring suburbs. The CDC doesn’t keep track of perpetrators, so we’ll look just at victims of homicides (gun and non-gun combined).
The highest homicide death rate per capita was in the county home to St. Louis, followed by Baltimore, New Orleans, Memphis, Philadelphia, Birmingham, Washington, D.C., and Kansas City.
The usual questions: Are these blue counties or red counties? Are they in blue states or red states? Well, almost all big cities and most big counties are run by Democrats, while states are more mixed.
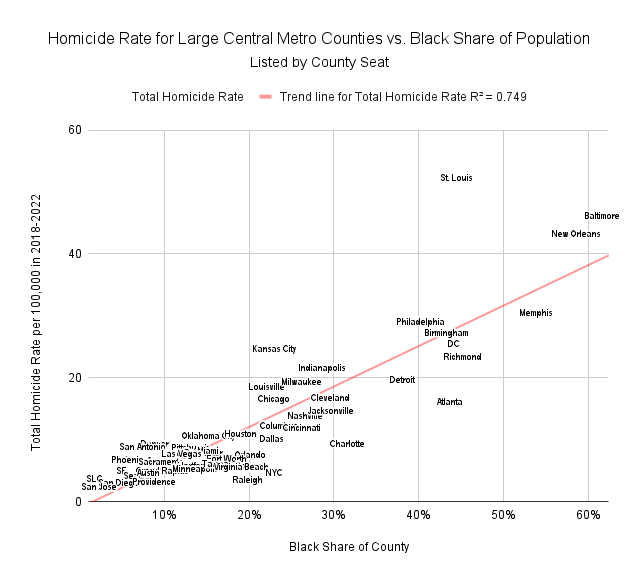
But what really jumps out from graphing the data is that high homicide rates in urban counties correlate with high black shares of the population, at a spectacular correlation coefficient of r = 0.87.
That’s the kind of correlation you seldom see in the social sciences.
That got me thinking: What if each urban county had the same racial demographics, say, one-third white, one-third black, and one-third Hispanic? Which big counties would be the most homicidal if I used each one’s white homicide victimization rate, black rate, and Hispanic rate and assumed equal shares of the population for each of the three major races to project the homicide rate?
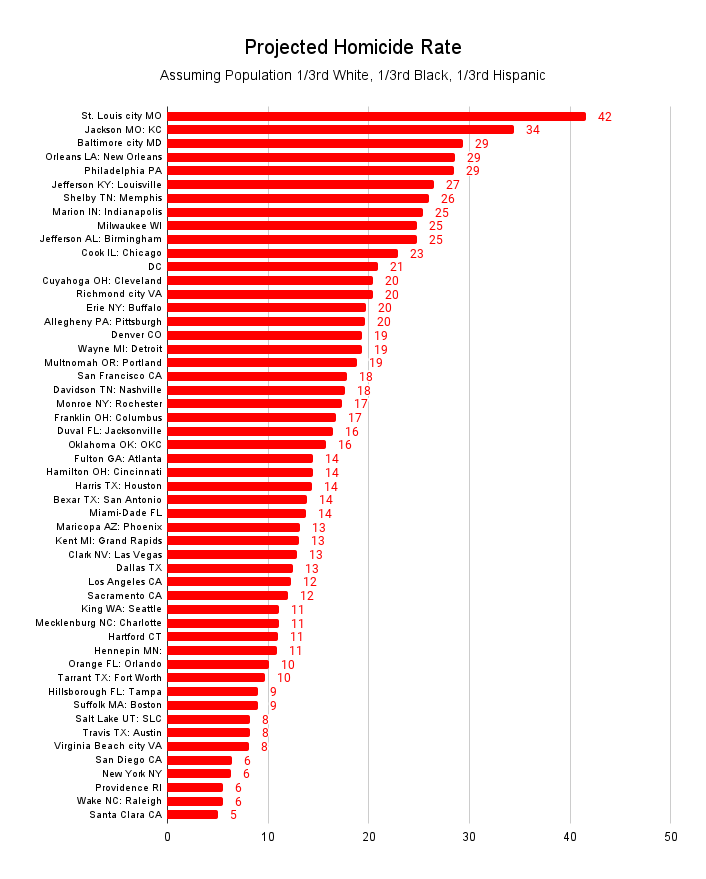
St. Louis is worst once again, this time followed by, yes, Kansas City, then Baltimore, New Orleans, and Philadelphia.
In general, the most lethal urban areas relative to their racial demographics tend to be Rust Belt cities with declining economies, often located on waterways that once served heavy industry. I suspect it’s not so much that unemployment forces people to pick up a gun to steal food to feed their families as that the more enterprising citizens have moved out to work in more modern economies, leaving a lumpenproletariat remnant behind to pass their time entertaining themselves by shooting each other.
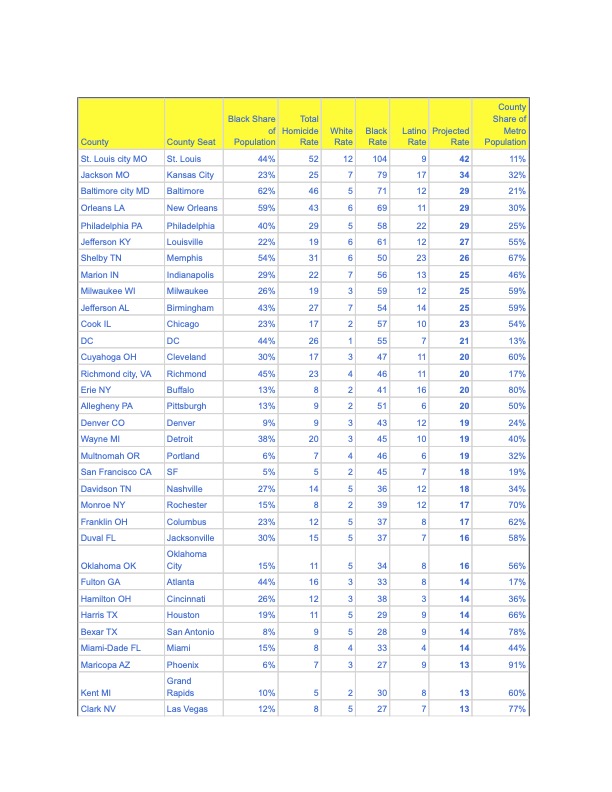
I’ve made up a table with the “projected rate” of homicide if every urban county was 33.3 percent white, black, and Hispanic:
The least homicidal large central metro county is, unsurprisingly, Santa Clara, Calif.; San Jose and Palo Alto, i.e., Silicon Valley.
Second best is more unexpected: Wake County, N.C., home to the state capital of Raleigh and the Cary part of Research Triangle. North Carolina was a trendy state twenty years ago, but then its banking, home-building, and furniture-oriented economy got hammered by the 2008 crash. Perhaps it’s time to give North Carolina another look?
Providence, R.I., is third best. You don’t hear much about Providence, but it seems to enjoy similar safety as its northeastern superstar neighbors, Boston and New York City. If you like northeastern city life but need affordability, perhaps you should check Providence out.
Speaking of the low murder rate in New York City (fourth best in the country), I’ve said it before, but I’ll keep saying it until rightists get it through their heads: The reclamation of the safety of the streets of New York during the Giuliani-Bloomberg-Bratton era is one of the heroic chapters in recent conservative governance.
Other urban counties that are safer than their racial demographics might suggest include those centered around increasingly utopian San Diego, military Virginia Beach, trendy Austin, and Mormon Salt Lake City. Tampa, Fort Worth, and Orlando look not bad either.
Methodological note: One somewhat unfair reason that St. Louis and Baltimore are so bad in this metric are that their counties, known as St. Louis City and Baltimore City, respectively, are coterminous with their city limits. So, St. Louis City comprises only 11 percent of the population of the sizable St. Louis metropolitan statistical area and Baltimore City only 21 percent of its MSA. (See the “County Share of Metro Population” column in the right edge of this table.) Thus, the central city-counties of St. Louis and Baltimore include a higher proportion of hardcore ghetto neighborhoods and a lower percentage of nice suburban neighborhoods than in many other listed counties.
In contrast, No. 7 Shelby County, Tenn., makes up 67 percent of the Memphis metro area, presumably including many of its more peaceful suburbs. So, Shelby County is even worse than its bad ranking suggests.
On the other hand, all these are awfully shooty places.
In summary, while I don’t think I’ve solved all the statistical problems with evaluating local law and order, I hope the procedures I’ve outlined here are a start toward getting past the analytical problems caused by the huge demographic disparities in crime rates. I encourage you to follow up on my findings.