June 14, 2023

Source: BIgstock
We live in an age blessed with ever-improving social science data, but few realize that, much less grasp its findings. The latest generation of longitudinal tracking databases can use genetic data to help find long-sought answers to politically crucial questions about race and IQ, but liberals don’t officially believe anymore that race or IQ even exists.
Conservatives would find the statistics helpful in gaining perspective on what has become the key domestic policy question of this decade: Whose fault is it that African Americans aren’t catching up anymore? Indeed, during the Black Lives Matter era since 2014, blacks have been getting themselves killed in increasing numbers.
According to today’s dominant worldview, the only answer to that question can possibly be: It’s the white man’s fault, either now or in the increasingly distant past. If the accusers can’t specify actions by living white men requiring them to be dispossessed of their home equity in the name of equity, well, that just proves how subtle and nuanced is systemic racism, which, by definition, proves the white man responsible for any and all disparities, and thus must pay.
Of course, data won’t ever fully disprove this faith-based demonology about who in 2023 must be the innocent victims and who must be the hereditary evildoers. But it can raise doubts in the minds of the less bigoted. And the facts sure are more interesting than the reigning orthodoxy.
But conservatives have shown little interest in the latest numbers, nor in fighting to preserve public access to them in an era trending toward censorship and secrecy.
So, I like to share with my readers new findings from the best data sources. Two weeks ago, I noted that the gold standard Adolescent Brain Cognitive Development (ABCD) database of a nationally representative sample of over 10,000 10-year-olds in 2016–18 shows that the racial gaps in IQ in the new generation were roughly as sizable as in the later 20th century. That the most important white-black gap still isn’t going away after more than a half century of strident anti-racism suggests that white racism isn’t the real problem.
Now Chuck at Human Varieties has sent me additional ABCD data related to IQ and the finer divisions of race/ethnicity. Of particular interest is how for each group as determined by parental self-identification of their child’s ancestry, we can also see their genetic racial makeup as well by using the genome analysis techniques that have made big businesses out of Ancestry.com and 23andMe. The American system of racial classification is largely based on self-identification, so it’s helpful to see how well self-identification matches up with the finding of genome scans.
In my graph, unlike in most these days that randomly assign colors to different races, I’m using my reader-friendly coloring scheme in which European ancestry is represented by blue (Europeans having most of the blue eyes in the world), East Asians by yellow, New World Amerindians by red, and sub-Saharan Africans by black.
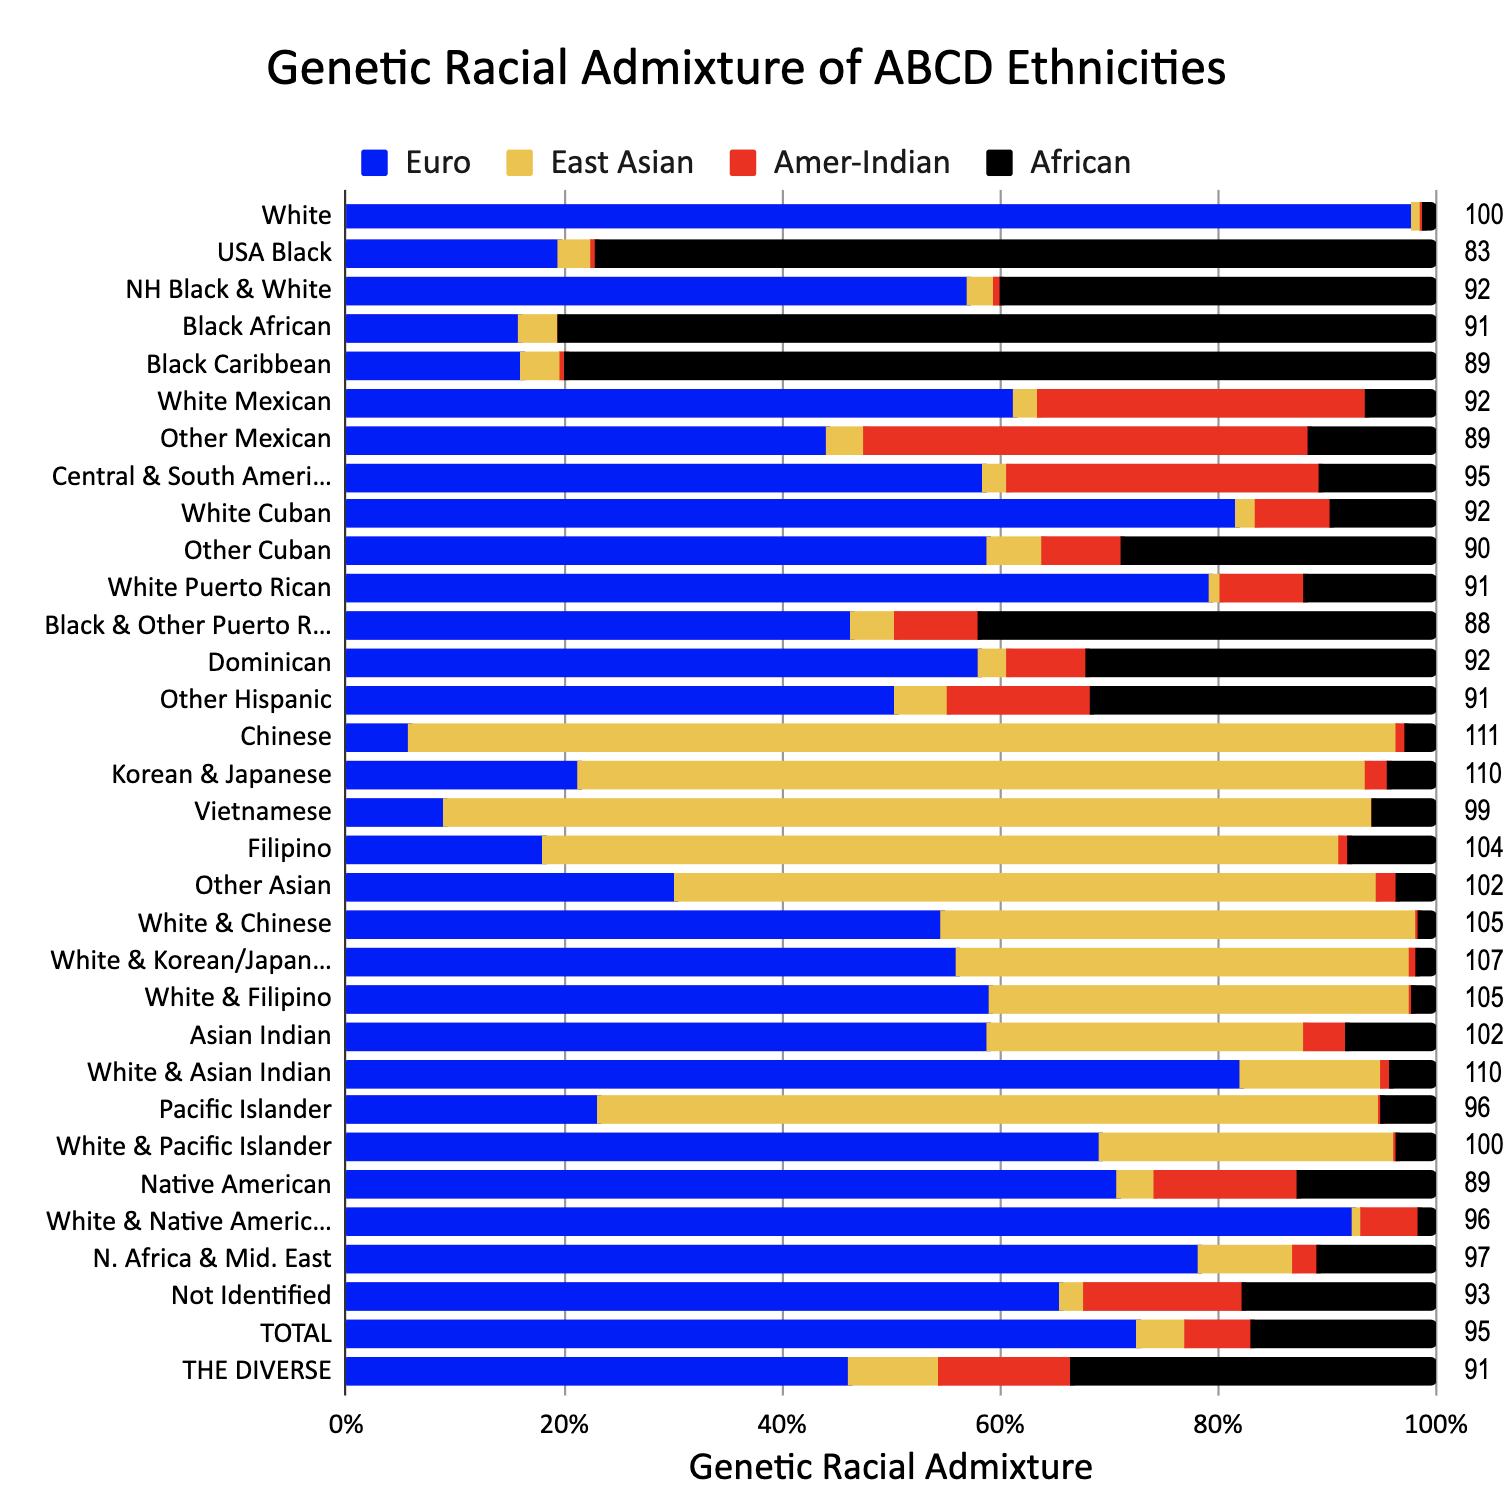
For example, consider the largest single group in the ABCD study, plain old White. These are kids who were identified by their parents as being of white race and no other specified race and not of Hispanic ethnicity nor Middle Eastern ancestry. By tradition, their average score on the ABCD’s elaborate set of cognitive tests is set to 100 (with a standard deviation of 15) to enable other groups’ IQs to be easily compared.
Under a simplistic Linnaean four-race model (European, East Asian, New World Indian, and Sub-Saharan), these kids’ genes indicate that, yes, they are fully 98 percent white, with only tiny shares of the three other races showing up in their genomes.
This is similar to the finding of Harvard geneticist David Reich that 23andMe customers who identify only as white tend to be about 98 percent white genetically.
MacArthur grant genius Ta-Nehisi Coates (whatever happened to him, anyway?) used to snidely refer to whites as “people who believe they are white.” But it turns out that in America, people who believe they are white really are awfully white genetically.
(Yes, it would be interesting to see the White category subdivided further. Perhaps another day…)
In contrast, kids whose parents identify them as core USA Black—i.e., born in the USA, not Hispanic, no recent immigrant ancestry, no white parent: in other words, descendants of American slaves—are 20 percent white on average.
Although we are supposed to believe that race does not exist scientifically and is merely a social construct, the biological reality is that there is little in the way of ambiguous overlap between the White and USA Black categories. Only a tiny number who identify as belonging to one category have been revealed by genetic testing to more realistically belong to the other.
Interestingly, this biological reality has been socially constructed since 1619 due to the Anglo world’s one-drop rule for defining who is black, which made it very hard for part-black people to pass as white and thus led to two rather genetically distinct populations. That’s why about 95 percent of self-identifying USA Blacks are genetically less than 45 percent white. And very few Americans who identify as non-Hispanic white are more than 10 percent black.
In contrast, in Latin American regions without the color line but with more of a color continuum, racial boundaries are much hazier. For example, the 133 ABCD subjects who were identified by their parents as racially white and Puerto Rican by ancestry average 79 percent white genes, 8 percent Amerindian, and 12 percent black.
In comparison, the ninety volunteers said to be Puerto Rican and black (or other race) average 46 percent white, 8 percent Amerindian, and 42 percent sub-Saharan.
In the three national ancestry groups (Puerto Ricans, Cubans, and Mexicans) broken out into both self-identified whites and nonwhites, the kids claimed by their parents to be white average a modest two or three IQ points higher.
Overall, most of the self-identified categories match up reasonably well with the genetic data. One problem area is Asian Indians. Because this analysis is using a reductionist four-race model, South Asians are allocated primarily between Europeans and East Asians, and are seen as being about twice as closely related genetically to the former than to the latter.
That was also the view of physical anthropologists before the genetic era: When measured with calipers and the like, Subcontinentals seemed more Caucasian than Oriental, so on the 1970 Census, they were counted as white. But Indian immigrant businessmen complained during the 1970s that Chinese immigrant businessmen were getting low-interest minority business development loans from the SBA and affirmative-action breaks on government contracting. Hence, on the 1980 Census, in an early example of Flight From White, South Asians were relumped with Orientals into the new Asian race.
But it would make more sense to break South Asians out as their own race.
Another exception to the general rule that American race classifications are good enough for government work is the kids designated American Indian by their parents, most of whom are highly white.
For example, the 39 subjects who are said to be nothing but Native American are only 13 percent Indian by genes, 71 percent white, and 13 percent black. The black component likely comes in some measure from “tri-racial isolates,” such as the Melungeons, Shinnecocks, and Brass Ankles, who settled in the backwoods at a time in the past when it was more advantageous to identify as American Indian than as black.
The genetic ancestry of the 144 volunteers who identify as white and Native American is only 5 percent American Indian and 92 percent white.
I’m not sure what the solution is, but official statistics definitely need to find a way to distinguish real Indians (e.g., the poor bastards living on reservations) from the growing hordes of Liz Warren-style LARPers. Perhaps the feds could divide them into two categories: Honest Indian vs. Native American Princess.
Here’s Chuck’s data in table form with the sample size (N) broken out, followed by average IQ, and the percentage of ancestry under a model with all genes allotted to one of four continental-scale races:
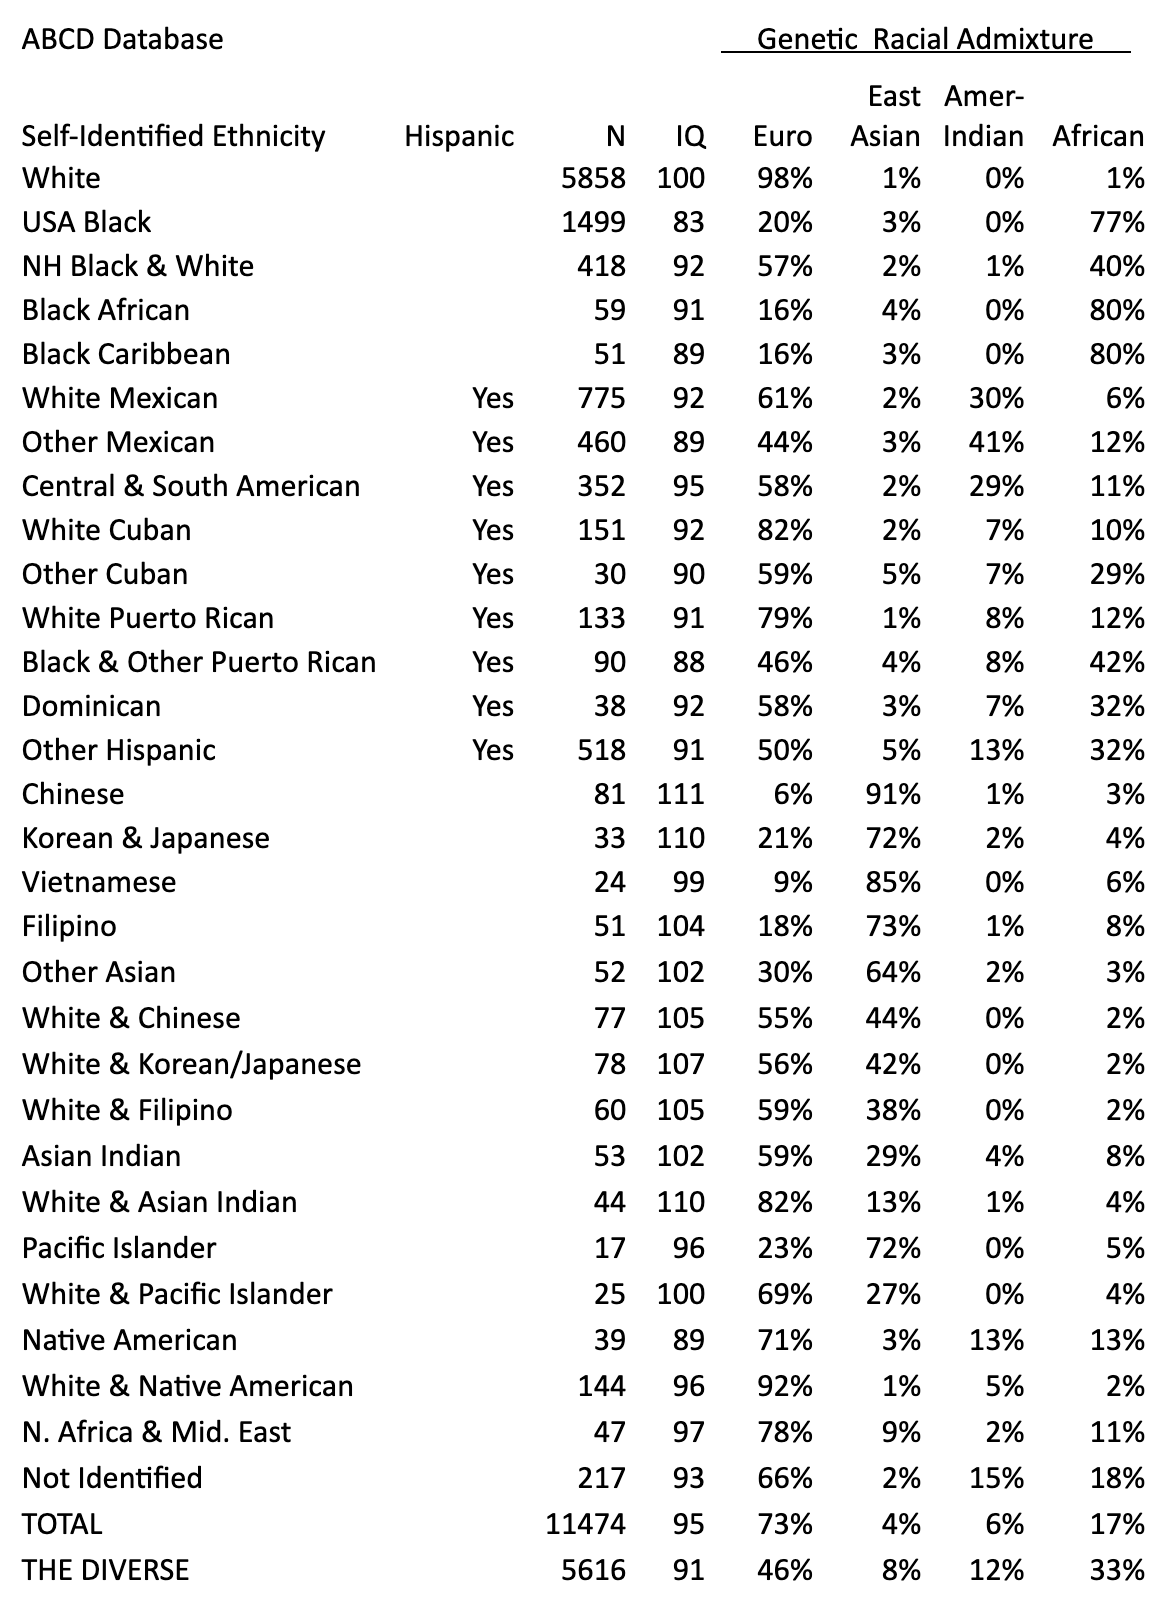
One modest issue is that there appears to be some leakage from one race to another. For example, I doubt that 3 percent of the genes of old-school USA Blacks are really East Asian by descent. Conversely, it also seems unlikely that Chinese-American kids are actually 3 percent black by heritage. This could be a problem caused by the severe lumping required to allocate all genes to one of just four races.
Or it could merely be a mistake. Genetic ancestry estimation has progressed dramatically since one firm informed Larry David that he was three-eighths Native American. But the process isn’t perfect yet.
How seriously should we take each of these line items?
A crude rule of thumb in the marketing research business is to never trust sample sizes of less than 30. Most of the findings from groups with high two-digit sample sizes are probably pretty reasonable, but a few of them are likely to be quite misleading. A Bayesian perspective suggests that the most unexpected and thus most interesting results are also the most likely to be incorrect.
So, while you can learn a lot from this table, please don’t get hung up on how one surprising data point from it proves or disproves your pet theory. It might just be a mistake.
All groups other than White average out to a 90.8 IQ.
Overall, Diversity, which is our strength (peace be upon it), causes the national average IQ to be 95.5, four and a half points lower than the white average.